This is first in series of posts on monitoring your wireless router. In this post we will setup node_exporter on the router which will allow us to pull basic performance metrics. I have an Asus RT-AC68U with AsusWRT-Merlin firmware installed on it. This allows me to setup cron jobs and custom scripts on the router which is required to setup the monitoring. You can check out the complete list of additional features that Merlin firmware provides. The instructions here should work on other Asus routers with Meriln firmware but might need some modifications to work on DDWRT or Tomato.
For pulling and persisting the metrics I am be using Prometheus which is an open-source monitoring solution. I have it installed on a home server which is up 24x7 and connected to the router. A static IP is configured for the server which makes things convenient but the setup will also work with a dynamic IP address assignment. Grafana is used to create a dashboard for router health.
We will be installing node_exporter on the router which will provide us a lot of metrics out of which following are of interest:
- CPU utilization
- Memory usage
- Network activity
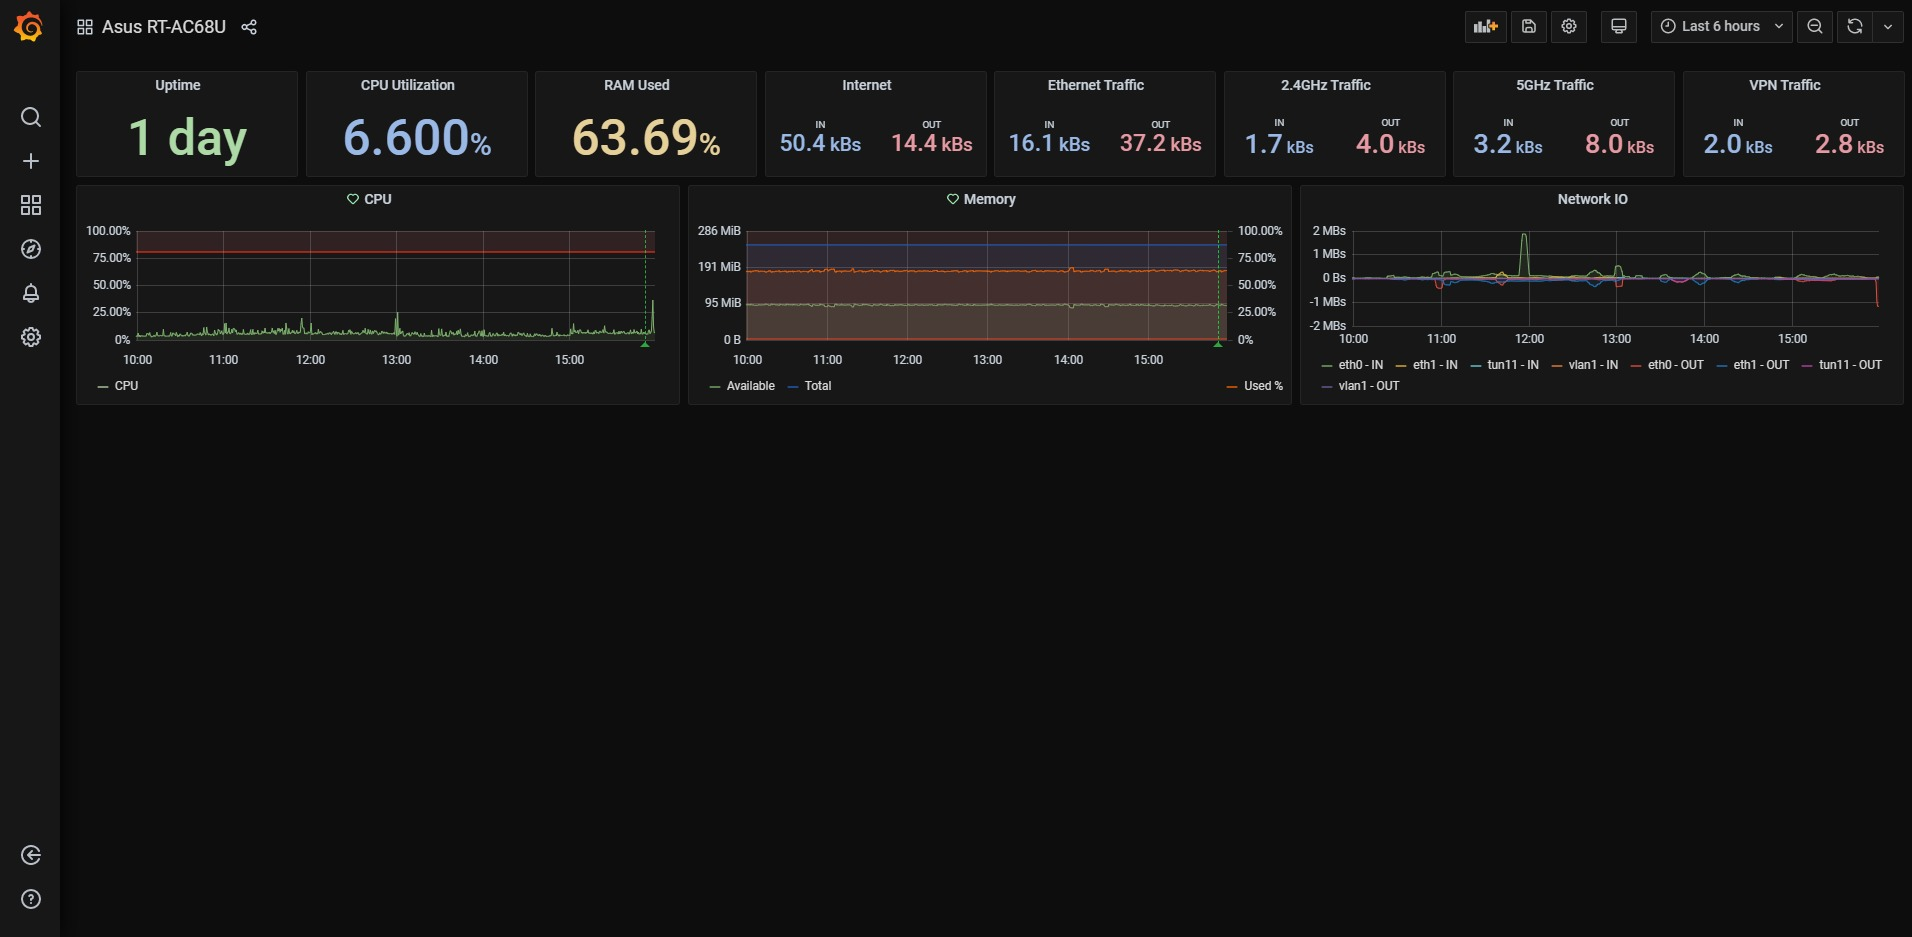
At the end of this post our dashboard will look something like this:
Prerequisites
You need an ARM based router with minimum 256MB of RAM. In addition to this you will need sufficient disk space (100MB) for exporters and configurations.
At the time of this writing node_exporter is using between 1-3MB of memory with router’s total memory utilization at 63%. The size of exporter binary
is 16.5MB. You also need to be able to SSH into the router.
You need to enable Custom JFFS scripts from Administration > System in your WebUI.
For the sake of this post I am assuming that we have an external USB stick connected to the router which is mounted at /mnt/<disk> and we have following
directory structure created:
/mnt/<disk>
|- bin
|- etc
  |- services
|- var
  |- log
  |- run
|- home
  |- user
|- tmp
You can create the directory structure using following command. (Change <disk> to the name of your disk.)
mkdir -p /mnt/<disk>/{bin,etc/services,home/user,var/{log,run},tmp}Installing node_exporter
Hop on to the releases page and grab the latest arm build for the router. For AC68U we need the ARM5 build. I am grabbing the version 1.0.0.
You can get to your router terminal via SSH and run following commands to get the exporter. (Change <version> with the version you want.)
cd /mnt/<disk>/home/user
wget https://github.com/prometheus/node_exporter/releases/download/v1.0.0/node_exporter-<version>.linux-armv5.tar.gz
tar xzf node_exporter-<version>.linux-armv5.tar.gz
mv node_exporter-<version>.linux-armv5/node_exporter /mnt/<disk>/bin/node_exporter
rm -rf node_exporter-<version>.linux-armv5*
Check if node_exporter is working using this command. It should print out the version and build information on the console. If you get an error you probably
grabbed a build for wrong platform.
/mnt/<disk>/bin/node_exporter --versionOnce the exporter is validated we need to configure the node_exporter to start on boot. First we create a service file /mnt/<disk>/etc/services/node_exporter.service
with following content in it. This scripts checks if the exporter is already running by fetching the PID of node_exporter. If not running it will start the node_exporter
in background.
#!/bin/sh

ROOT_DIR=$1
CMD="$1/bin/node_exporter"
LOG="$1/var/log/node_exporter.log"

pidof node_exporter

if [[ $? -ne 0 ]] ; then
    $CMD --web.listen-address=":9101" >> "$LOG" 2>&1 &
else
    echo "Already running"
fi
Mark this file as executable:
chmod 755 /mnt/<disk>/etc/services/node_exporter.serviceNow we can run the service to start our exporter.
/mnt/<disk>/etc/services/node_exporter.serviceVisit http://<your_router_ip>:9101/metrics. If you are greeted with a page with prometheus metrics we are good to go. Following
is a snippet of what you should see on the page.
# HELP go_gc_duration_seconds A summary of the pause duration of garbage collection cycles.
# TYPE go_gc_duration_seconds summary
go_gc_duration_seconds{quantile="0"} 0.000138551
go_gc_duration_seconds{quantile="0.25"} 0.00018608
go_gc_duration_seconds{quantile="0.5"} 0.000246878
go_gc_duration_seconds{quantile="0.75"} 0.000339976
go_gc_duration_seconds{quantile="1"} 0.010150014
go_gc_duration_seconds_sum 2.515875774
go_gc_duration_seconds_count 3756
--- truncated ---
Now we configure this service file to be run on boot. During the boot process we need to ensure that the external usb is mounted
before we call this script. We will be using the post-mount script. Create a file /jffs/scripts/post-mount if it not already
exists. Add following content to the file. The post-mount script is passed the mountpoint as the first argument. In
the script we check if the disk mounted is the one which has our service file. If yes then we invoke the script. Beware that you
should not execute any blocking action in this script as the boot process waits for this script to exit. (Change <disk> with correct disk name)
#!/bin/sh

MOUNTPOINT=$1

if [[ $MOUNTPOINT == "/tmp/mnt/<disk>" ]]; then
    echo "$1 Mounted" >> "$1/var/log/syslog"
    CMD="$1/etc/services/node_exporter.service"
    $CMD "$1"
fi
Thats it for the setup on the router end. Now we move on to configure Prometheus.
Configuring Prometheus
In your scrape_configs section add the section for router job. (Change <your_router_ip> with correct IP.)
scrape_configs:
  - job_name: router
    static_configs:
    - targets:
      - '<your_router_ip>:9101'
Restart prometheus and you are done with configuring the metric pull. Next is the Grafana dashboard.
Grafana Dashboard
The panels have been created on Grafana v7.0.3. You can download the Dashboard JSON here.
Uptime (Single Stat)
This will give us the time since last router restart. Following is the PromQL:
time() - node_boot_time_seconds{job="router"}CPU Utilization (Single Stat & Chart)
Average CPU utilization on the router over last 5 minutes.
1 - avg(irate(node_cpu_seconds_total{mode='idle', job="router"}[5m]))Memory Utilization (Single Stat)
Current memory utilization in percentage.
1 - node_memory_MemFree_bytes{job="router"}/node_memory_MemTotal_bytes{job="router"}Internet Usage (Single Stat)
This will tell us the current download/upload speed over WAN (internet). This is tricky because you will have to know the interface name
of WAN network for your router. For Asus Merlin the ppp0 is the WAN interface. You will have to change value of device label in
the following PromQL queries if you have a different router.
# Download speed
irate(node_network_receive_bytes_total{job="router", device="ppp0"}[5m])

# Upload Speed
irate(node_network_transmit_bytes_total{job="router", device="ppp0"}[5m])
Interface usage (Single Stat)
If you wish to know the traffic over different connection modes like Ethernet, WiFi 5Gz or 2.4G channels you can use following queries.
Again the interface names used here apply to Asus router and your router might be designating different interfaces. Also note that
IN and OUT over here is from point of view of router. So an IN for router may be, depending on the interface, an upload from device.
Following are interface assignments for Asus routers:
vlan1is Etherneteth1is 2.4G WiFi channeleth2is 5G WiFi channelppp0is WAN interfacetun<x><y>are the VPN tunnel interfaces
# Ethernet IN
irate(node_network_receive_bytes_total{job="router", device="vlan1"}[5m])

# Ethernet OUT
irate(node_network_transmit_bytes_total{job="router", device="vlan1"}[5m])

# 5G IN
irate(node_network_receive_bytes_total{job="router", device="eth2"}[5m])

# 5G OUT
irate(node_network_transmit_bytes_total{job="router", device="eth2"}[5m])

# 2.4G IN
irate(node_network_receive_bytes_total{job="router", device="eth1"}[5m])

# 2.4G OUT
irate(node_network_transmit_bytes_total{job="router", device="eth1"}[5m])

# VPN IN
irate(node_network_receive_bytes_total{job="router", device="tun11"}[5m])

# VPN OUT
irate(node_network_transmit_bytes_total{job="router", device="tun11"}[5m])
Memory usage (Chart)
Charts the memory usage in bytes and percentage over time.
# Free
node_memory_MemFree_bytes{job="router"}

# Total
node_memory_MemTotal_bytes{job="router"}

# Percentage used
1 - node_memory_MemFree_bytes{job="router"}/node_memory_MemTotal_bytes{job="router"}
Network traffic (Chart)
Charts traffic over multiple network interfaces.
# IN
rate(node_network_receive_bytes_total{job="router", device=~"vlan1|eth0|eth1|tun11"}[5m])

# Total
rate(node_network_receive_bytes_total{job="router", device=~"vlan1|eth0|eth1|tun11"}[5m])
Conclusion
Thats it! We have setup node exporter on our router, configured prometheus to pull the metrics and created a grafana dashboards to chart the metrics.